
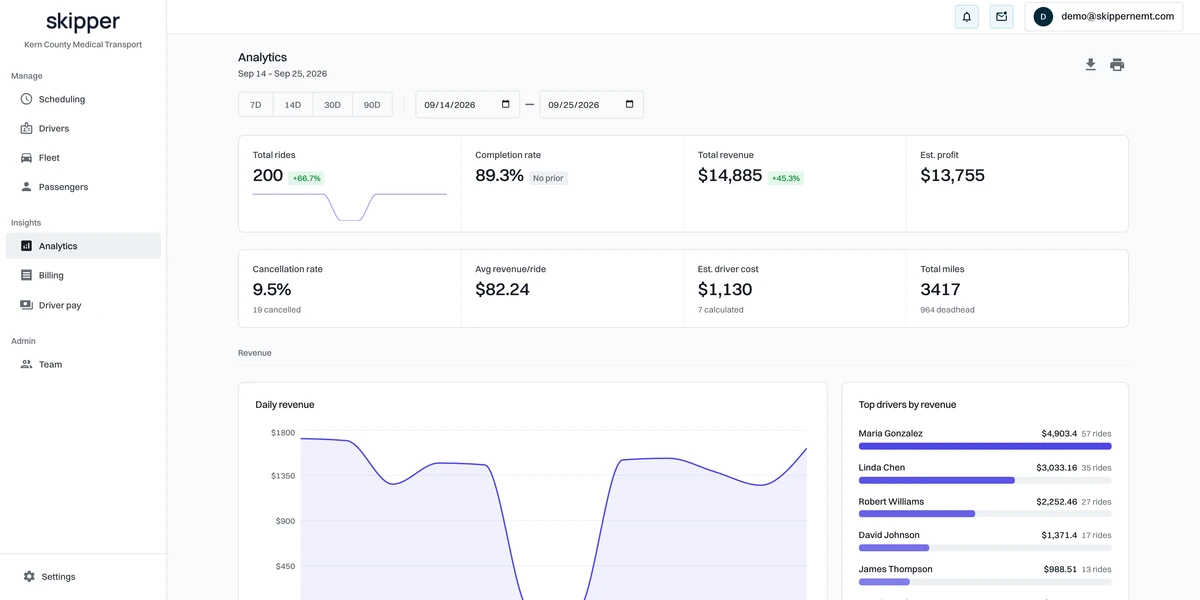
What's in Analytics
Operations
- Completion and cancellation rates
- No-show dashboard
- Give-backs report
- Total and deadhead miles
Revenue
- Revenue by day
- Revenue per ride
- Drivers ranked by revenue
Ranges and export
- 7, 14, 30 and 90-day ranges or custom dates
- CSV export
Frequently asked questions
Yes. Drivers are ranked by revenue and rides for any date range, and the list exports to CSV.
See Skipper on your own trips
A 30-minute call with our team. We will walk through Skipper using trips like yours and follow up with pricing.